Calorie and Activity Statistics Explain Americas Weight Problem
Recently a national on-line news magazine came out with what may be developing
into an annual event. For the 3rd straight year, they asked experts to
rate diets. In this case, 19 panelists ranked 29 diets for a number of
categories including weight loss. 1. Since every diet has supporters and
only can have the highest ranking, this exercise can start as many arguments
as ranking the 29 cutest breeds of puppies. After I read what they had
to say, rather than getting pulled into a food fight (pun intended) my
thoughts centered on why we need so many diets and decided it was time
for an obesity update.
Obesity Update
The good news is that America’s obesity explosion appears to have
leveled off. In fact, the US is no longer the fattest nation on earth
having just been passed by Mexico. The bad news is almost 7/10 adults
in America need to lose weight. See Tables 1 & 2. The reason is simple
– too many calories ingested, too few calories expended. I made
table 3 from information provided by the United States Department of Agriculture’s
Economic Research Service division. In a long and complex process they
use a series of inventory measurements, estimates and formulas to calculate
the average calories per day Americans consume. This is not an exact science,
nor do any of the authors and/or USDA staff claim otherwise. But it is
an excellent tool to compare ourselves with ourselves over time.. Take
a look at table 3 and you will notice Americans went on a 25 year bender
from 1975 to 2000. Although I elected list data at 5 year intervals, from
2000 to 2007 America hit a 7 year calorie plateau. From 2008 to 2010 there
were slight declines for 3 straight years - something not seen since1972-1975.
If you compare 1975 with 2010 you will see an increase of ~484 calories
per day 92% of which (~446 calories) from grains, added fats and added
sugars .The approximate breakdown in terms of calorie source is ~ 237
calories from fats and ~ 209 calories from carbohydrates.
While the anti-fat and anti-carb crowds continue to blame each other for
America's weight problem, the data shows that 7/10 Americans didn’t
become overweight from a single macronutrient. Nor will the problem be
solved by a single macronutrient. The best chance for success is to tailor
a program to fit a persons specific needs. This conflicts with the current
model of having people conform to a program.
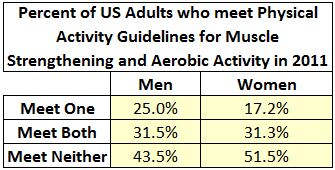
Insufficient activity is the other major factor in the fattening of America.
In 2008 the United States Department of Health and Human Services published
new exercise guidelines. Table 3 shows how many Americans meet the recommendations
of:
150 minutes a week of moderate intensity aerobic activity or 75 minutes
of high intensity aerobic activity and 2 days a week of strength exercise.
CONCLUSION
Table 3 shows just over 7/10 adults are underactive. And table 2 shows
just under 7/10 adults are overweight. That must be a coincidence because
' too many bites and too few steps' makes the problem seem too easy.
TABLE 1
The body mass index (BMI) is a popular way for epidemiologists to classify
the weight of large groups of people. BMI is calculated in the following
ways: The body weight in kilograms divided by the height in meters squared;
or the body weight in pounds divided by the height in inches, squared
and multiplied by 705. The BMI is fairly accurate for normal people. It
is not as accurate for extremely short people or athletic people (heavy
exercisers) of normal size and completely inaccurate for those who are
heavily muscled. BMI accuracy improves when used to compare large sample
sizes.
TABLE 1

TABLE 2
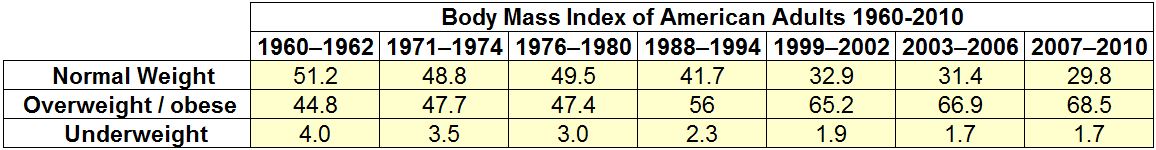
TABLE 3
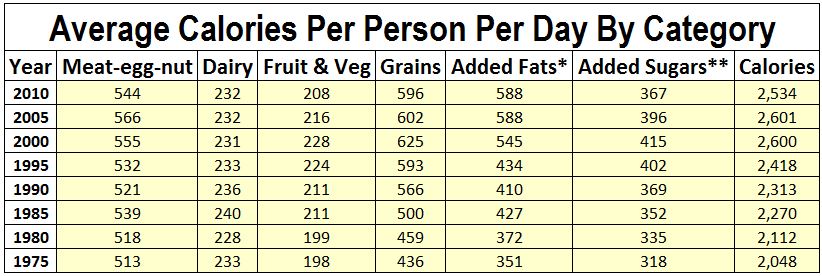
* From United States Department
of Agriculture food disappearance data
[Beginning food stocks – ending stocks + imports – spillage,
spoilage, plate waste, misc loss]
** Excludes naturally occurring fats & sugars
TABLE 4
1. US News and World Report. January 2013 accessed July
2013. http://health.usnews.com/best-diet
2.National Center for Health Statistics. Health, United States, 2012:
With Special Feature on Emergency Care. Hyattsville, MD. 2013. From Table
68 p. 220
3 Schiller JS, Lucas JW, Ward BW, Peregoy JA. Summary health statistics
for U.S. adults: National Health Interview Survey, 2010. National Center
for Health Statistics. Vital Health Stat 10(252). 2012. P 100
4.National Center for Health Statistics. Health, United States, 2012:
With Special Feature on Emergency Care. Hyattsville, MD. 2013. From Table
67 p . 215
916 E. Imperial Hwy.
Brea, CA. 92821
(714) 990-0824
Fax: (714) 990-1917
gdandersen@earthlink.net
www.andersenchiro.com
Copyright 2013, G. Douglas Andersen, DC, DACBSP,
CCN, 916 E. Imperial Hwy, Brea, CA 92821, (714) 990-0824
Home/Contact
| Bio | Articles
| Favorite
Supplement List | Nutrition
Services | Nutrition Tables
How to Choose A Chiropractor
| Speaking Engagements |
Nutrition
Book List | Photos